Getting started
Installation
- Install the application from the monday.com apps marketplace.
- Add the 'Agile Reports' view to the board or dashboard.
Example Burndown chart
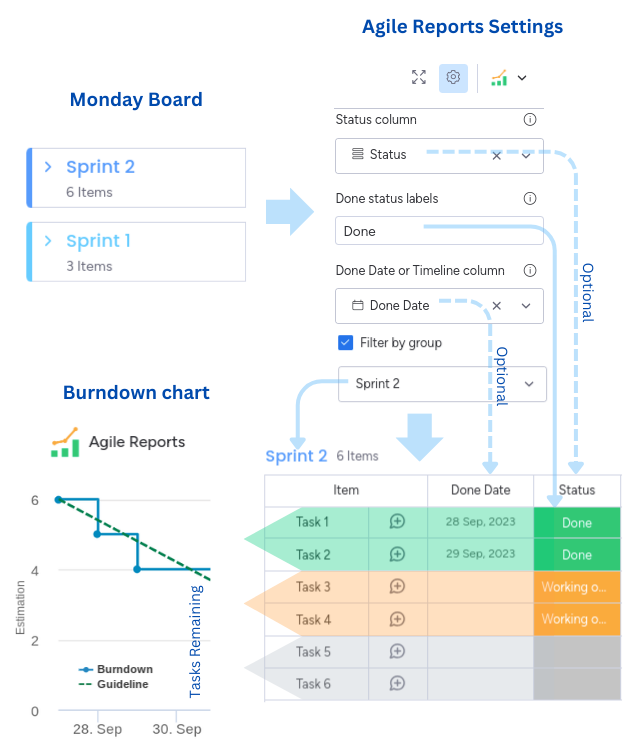
Charts in this tool track the sum of selected column values (or count the number of items) that meet specific criteria on a timeline. You can define these criteria using the filter section in the chart settings, filtering by column value or group.
Here is an example of Burndown chart for a Sprint 2:

Notes:
-
In this example the chart uses the date when a status change was made to the item. Depending on definition of done the chart can rely on a date column from the board.
-
The set of filters defines the project scope, and items that meet the filter criteria on specific dates will be visible on the plot. For example, when items are added to the filtered group today, plot will display:
- Zero for all dates in the past (because items were not in the filtered group in the past)
- A vertical line for today's date, with all items added to the group today (because today is the first date when items meet the filter criteria).
First time use
-
Add a chart as either a board view or a dashboard widget.
-
Go to the application's settings (Press the "Open Settings" button).
-
Set the chart Start and End dates.
Set the chart 'Start date', for example, your sprint start date. Set the chart 'End date', for example, your sprint end date. -
Select the "Estimation column" or tick "Use number of items".
The estimation column is a numerical column representing the amount of effort required to complete the task. If you don’t have an estimation column on your board select ‘Use number of items’. -
Configure definition of done.
The "definition of done" is based on how you mark tasks as complete on your board. Choose one of three setups:-
Configure both "Status column" and "Done Date or Timeline column"
Tasks are considered done when the Status is set to done and a date is set. The chart uses the date from the date column. -
Configure only "Done Date or Timeline column"
Tasks are considered done when the date is set. The chart uses the date from the date column. -
Configure only "Status column"
Tasks are considered done when marked as such in the status column. The chart automatically uses the date when the status column was changed to "done".noteSetup with only the "Status column" can access status change dates from the past few months, depending on board activity. If you need to preserve historical data for longer periods, it's recommended to use one of the other two configurations with a date or timeline column.
-
You should now see the plot on your board or dashboard.
If desired, follow these additional steps:
-
In the application settings, type into 'Done status labels' text that represent completed work, use a comma-separated list (e.g., Fixed,Done).
To support multiple languages and labels you can type in this field the status label text that is used to mark tasks as completed or done.
For example, if you set status to 'Published' when the task is completed type Published in 'Done status labels' field. -
Use filters from the application settings to narrow down the items displayed on the chart.
For example, tick 'Filter by group' to show items only from a specific group. Filters define scope of the project. When the filter is not enabled all items on the board are considered within a project scope.